
Who is this feature available to:
Any venue that has an integration.
Where is this feature:
Venue > Open Dashboard > Reports > Reporting Dashboard
Tables and graphs are available on the Dashboard giving venues an overall view of customer spends and sales data. The first available dashboard is the ‘Reporting Dashboard’.
Table of Contents
Reporting Dashboard
This dashboard displays multiple widgets depending on the data available.

-
Guests
-
Total Spend Per Booking Size
-
Duration of Booking x Spend
Guests widget
This widget show guest data based on the venue and the duration (from date and to date).
Table data
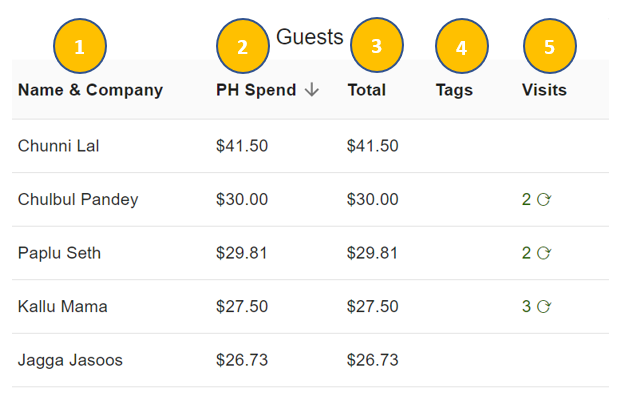
Table information
|
|
Columns |
Description |
Calculation |
Notes |
|---|---|---|---|---|
|
1 |
Name & Company |
Name of the customer and the company on the booking (if applicable) |
N/A |
|
|
2 |
PH Spend |
Average spend across all bookings for customer |
Spend Total / Total number of bookings sales data received for |
Sales data only appears for bookings that have a status of ‘Finished’ |
|
3 |
Spend Total |
Total amount spend across all bookings |
Booking 1 (transaction total / pax) + Booking 2 (transaction total / pax) + … |
Transaction total is not a sum of sales data (as that is not always reliable) |
|
4 |
Tags |
Tags on the booking |
N/A |
|
|
5 |
Visits |
The number of visits this customer has had |
Total number of visits for customer |
Includes all bookings for a customer except for:
|
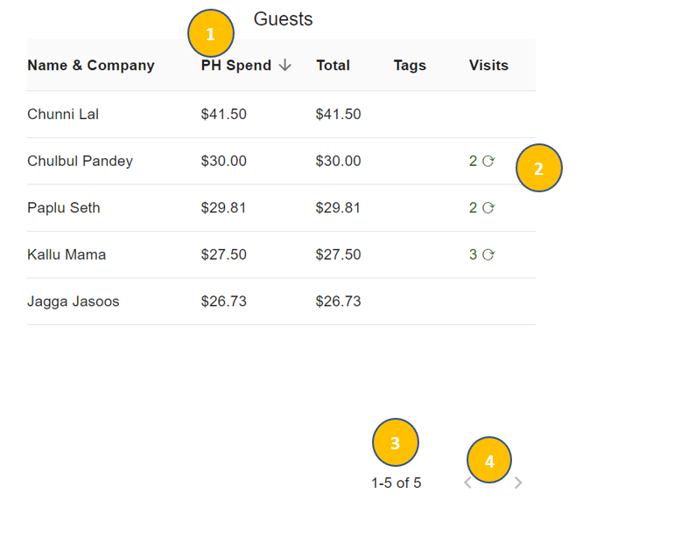
Additional table features
-
Sorting
-
Visits
-
Number of results
-
Pages
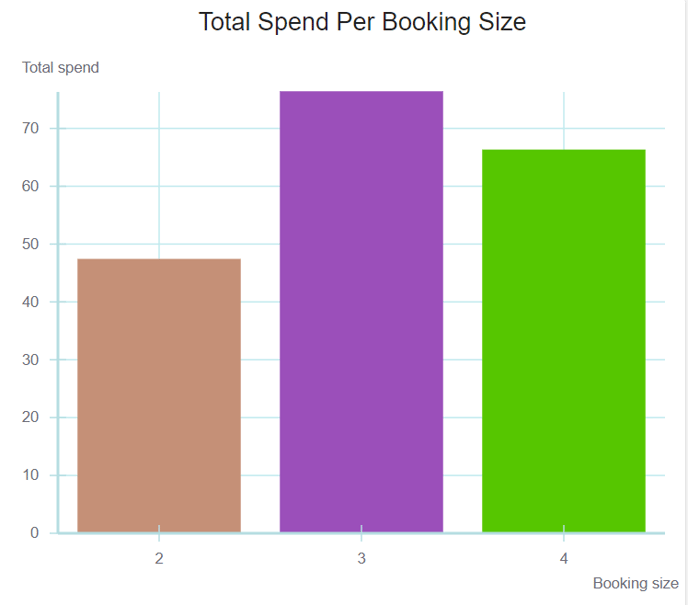
Total Spend Per Booking Size widget
This widget shows an overall graph of total spend by pax.
Graph data
Graph information
-
X axis = Number of people in a booking
-
Y axis = Average total spend
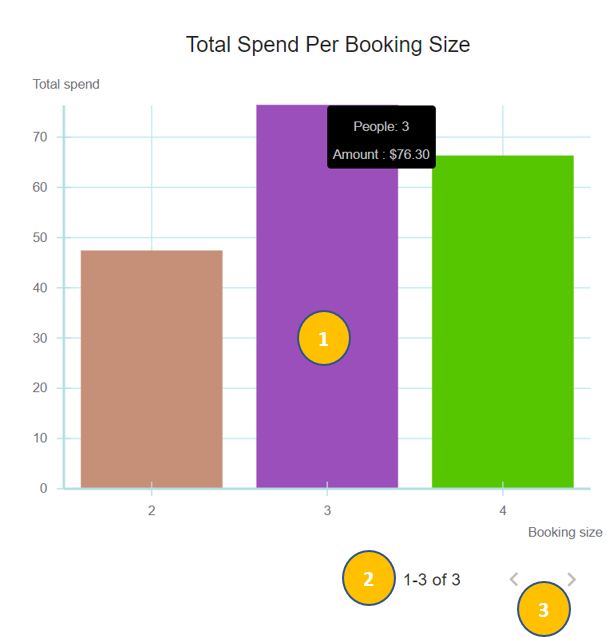
Additional graph features
-
Rollover to see extra information
-
Number of results
-
Pages
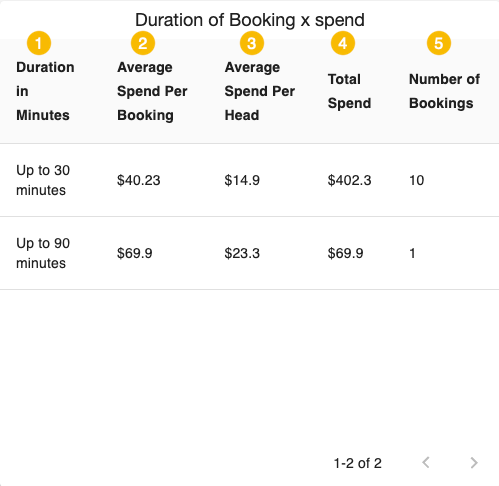
Duration of Booking x Spend
This widget shows the average and total spend of bookings grouped by duration.
Table data
|
|
Columns |
Description |
Calculation |
Notes |
|---|---|---|---|---|
|
1 |
Duration in minutes |
Duration blocks (in 30 minute intervals) starting at ‘Up to 30 minutes’ |
If booking is:
|
|
|
2 |
Average Spend Per Booking |
Average spend per booking for the duration indicated |
Sum of ‘Total Spend’ for all bookings / Total number of bookings for the duration indicated |
|
|
3 |
Average Spend Per Head |
Average spend per head for the duration indicated |
Sum of ‘Total Spend’ for all bookings / Total number of heads for the duration indicated |
|
|
4 |
Total Spend |
Total amount of money spent for all bookings for the duration indicated |
Sum of ‘Total Spend’ for all bookings for the duration indicated |
|
|
5 |
Number of Bookings |
Total number of bookings for the duration indicated |
Sum of all bookings for the duration indicated |
|
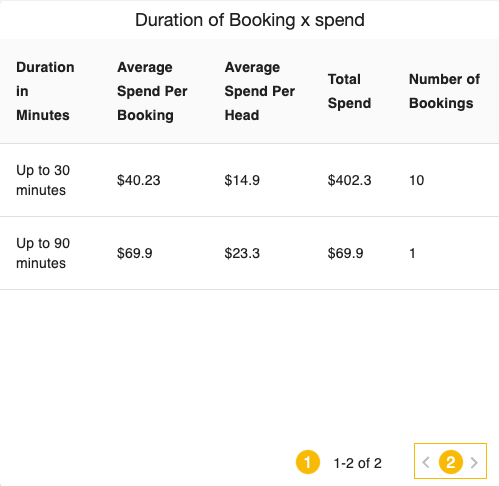
Additional table features
-
Number of results
-
Pages